Capturing Request-Response and Latency Details
Using the watch command, you can collect specific network traffic and parse them into request-response pairs, allowing you to:
- View detailed request-response content.
- Observe latency details, including key timestamps for when a request reaches the network interface, when a response reaches the network interface, when it arrives at the Socket buffer, and when the application process reads the response.
Let's start with a basic example:
kyanos watchSince no filter is specified, kyanos will attempt to capture all traffic it can analyze. Currently, kyanos supports parsing three application-layer protocols: HTTP, Redis, and MySQL.
When you execute this command, you’ll see a table like this: 
By default, watch collects 100 request-response records. You can
specify this using the --max-records option.
Each column represents:
| Column Name | Description | Example |
|---|---|---|
| id | Table's Sequence number | |
| Connection | The connection for this request-response | "10.0.4.9:44526 => 169.254.0.4:80" |
| Proto | Protocol used for the request-response | "HTTP" |
| TotalTime | Total time for this request-response, in milliseconds | |
| ReqSize | Request size, in bytes | |
| RespSize | Response size, in bytes | |
| Net/Internal | If send request as a client, it shows network latency; if received as a server, it shows internal processing time | |
| ReadSocketTime | For client, time spent reading the response from the Socket buffer; for server , reading requests time from the buffer |
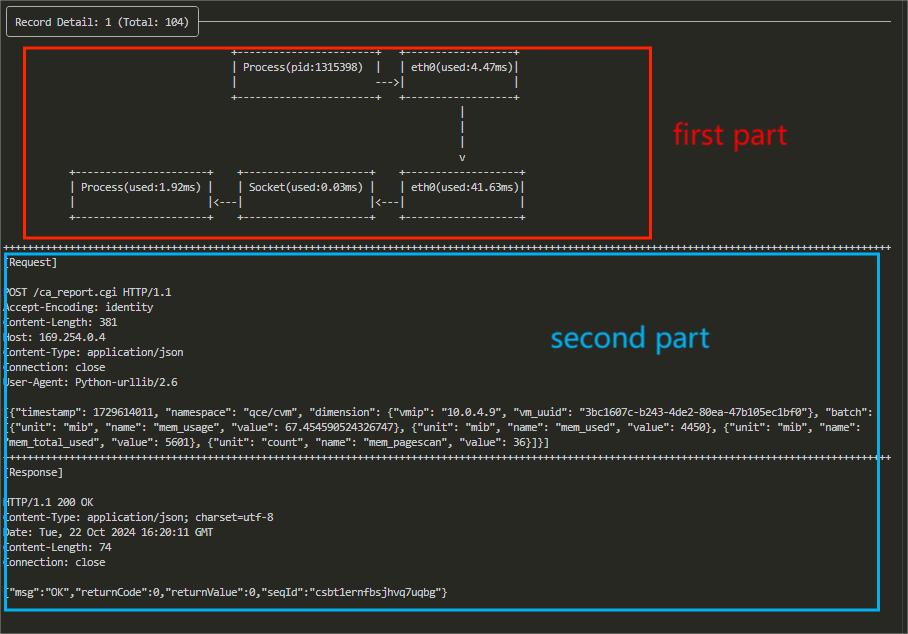
You can sort by column using the number keys and navigate through records using the "↑"/"↓" or "k"/"j" keys. Pressing Enter opens the details view for a specific request-response:

In the details view, the first section shows latency details with each block representing a step in the data packet's journey—such as the process, network card, and Socket buffer.
Each block displays the time taken between these points, allowing you to trace the flow from when a request is sent by the process to when a response is received, with step-by-step latency.
The second section contains the request and response content, split into Request and Response parts. Content exceeding 1024 bytes is truncated, but you can adjust this limit using the --max-print-bytes option.
How to Filter Requests and Responses ?
By default, kyanos captures all traffic for the protocols it currently supports. However, in many scenarios, you might need to filter more precisely. For example, you may want to focus on requests sent to a specific remote port, or related to a certain process or container, or queries tied to specific Redis commands or HTTP paths.
Below are the ways to use kyanos options to filter request-responses you're interested in.
Filtering by IP and Port
kyanos supports filtering based on IP and port at the network layer (Layer 3/4). You can specify the following options:
| Filter Condition | Command Line Flag | Example |
|---|---|---|
| Local Connection Ports | local-ports | --local-ports 6379,16379 Only observe request-responses on local ports 6379 and 16379. |
| Remote Connection Ports | remote-ports | --remote-ports 6379,16379 Only observe request-responses on remote ports 6379 and 16379. |
| Remote IP Addresses | remote-ips | --remote-ips 10.0.4.5,10.0.4.2 Only observe request-responses from remote IPs 10.0.4.5 and 10.0.4.2. |
| Client/Server side | side | --side client/server Only observe requests and responses when acting as a client initiating connections or as a server receiving connections. |
Filtering by Process/Container
| Filter Condition | Command Line Flag | Example |
|---|---|---|
| Process PID List | pids | --pids 12345,12346 Separate multiple PIDs with commas. |
| Process Name | comm | --comm 'curl' |
| Container ID | container-id | --container-id xx Specify the container ID. |
| Container Name | container-name | --container-name foobar Specify the container name. |
| Kubernetes Pod Name | pod-name | --pod-name nginx-7bds23212-23s1s.default Format: NAME.NAMESPACE |
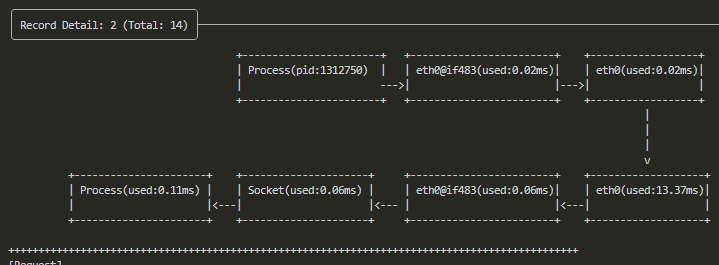
It's worth mentioning that kyanos also displays latency between the container network card and the host network card: 
Filtering by Request-Response General Information
| Filter Condition | Command Line Flag | Example |
|---|---|---|
| Request-Response Latency | latency | --latency 100 Only observe request-responses that exceed 100ms in latency. |
| Request Size in Bytes | req-size | --req-size 1024 Only observe request-responses larger than 1024 bytes. |
| Response Size in Bytes | resp-size | --resp-size 1024 Only observe request-responses larger than 1024 bytes. |
Filtering by Protocol-Specific Information
You can choose to capture only request-responses for a specific protocol by adding the protocol name as subcommand. The currently supported protocols are:
httpredismysql
For example, to capture only HTTP requests to the path /foo/bar, you would run:
kyanos watch http --path /foo/barHere are the options available for filtering by each protocol:
HTTP Protocol Filtering
| Filter Condition | Command Line Flag | Example |
|---|---|---|
| Request Path | path | --path /foo/bar Only observe requests with the path /foo/bar. |
| Request Path Prefix | path-prefix | --path-prefix /foo/bar Only observe requests with paths started with /foo/bar. |
| Request Path Regex | path-regex | --path-regex "\/foo\/bar\/.*" Only observe requests with paths matching the regex \/foo\/bar\/.*. |
| Request Host | host | --host www.baidu.com Only observe requests with the host www.baidu.com. |
| Request Method | method | --method GET Only observe requests with the method GET. |
Redis Protocol Filtering
| Filter Condition | Command Line Flag | Example |
|---|---|---|
| Request Command | command | --command GET,SET Only observe requests with the commands GET and SET. |
| Request Key | keys | --keys foo,bar Only observe requests with the keys foo and bar. |
| Request Key Prefix | key-prefix | --key-prefix foo:bar Only observe requests with keys that have the prefix foo:bar. |
MySQL Protocol Filtering
MySQL protocol capturing is supported, but filtering by conditions is still in development...
All of the above options can be combined. For example:
./kyanos watch redis --keys foo,bar --remote-ports 6379 --pid 12345This flexibility allows you to tailor your traffic capture to your specific needs, ensuring you gather only the most relevant request-response data.
